

Traditional active investment managers strive to beat the market – they rarely succeed. Studies have shown less than 10% of active investment managers consistently outperform the market and when their fees are taken into account that figure falls to less than 1%.
Markets throughout the world have a history of rewarding investors for the capital they provide. Allocating funds to the sections of a market that offer long-term risk and return characteristics is shown to be the most successful way to capture market returns.
So the question is: why continually try and outwit the market when it exists to work for you?
This chart compares the returns delivered by the US share market over a 20-year period, against the returns of the average equity investor.
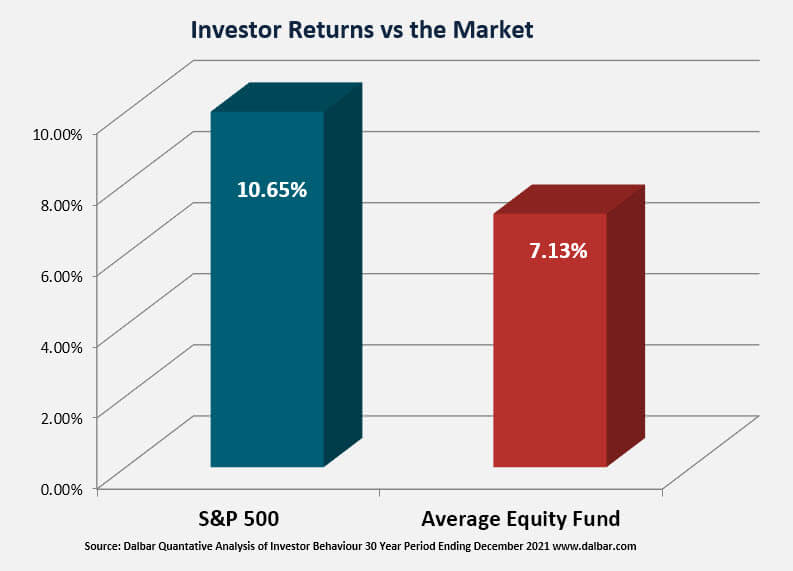
As you can see, there’s a significant difference between market returns and what the average investor achieves. And there are pointed reasons why the average investor continues to deny themselves those higher market returns:
- Paying high fees
- Focussing on pre-tax returns
- Trying to time the market
- Failing to diversify
- Chasing last year’s winner
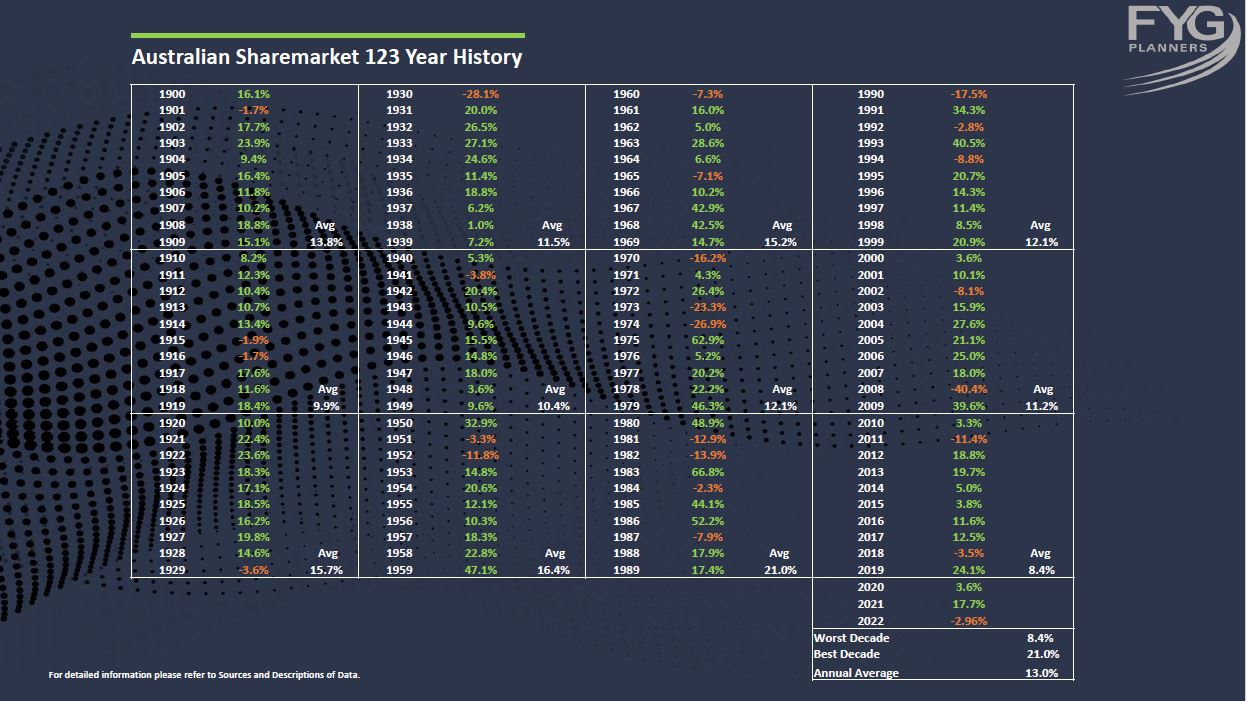
123 years of Australian share market returns illustrate if an investor picks and sticks with a strategy that works with the market, their patience will be rewarded.
At Foundation Wealth Planners we work with the market and focus on what we can control.