

Economic Overview
Global markets struggled across the board in Q1 for a clear reason, the beginning of the conflict in the Middle East, which led to a major disruption in global energy supply and some damage to middle eastern energy infrastructure. Weakness in US tech stocks, and tech stocks globally, also contributed to weakness across Q1. Japan and the UK were the outliers with positive returns for the quarter in the wake of February’s elections in Japan, and the UK benefiting from heavy energy exposure and a falling pound. Emerging markets fared better than many developed markets, with early gains in the tech heavy South Korean and Taiwanese markets offsetting March’s falls. Government bonds also experienced a sell-off as the reality of higher commodity prices increased worries about inflation and potential interest rate rises.
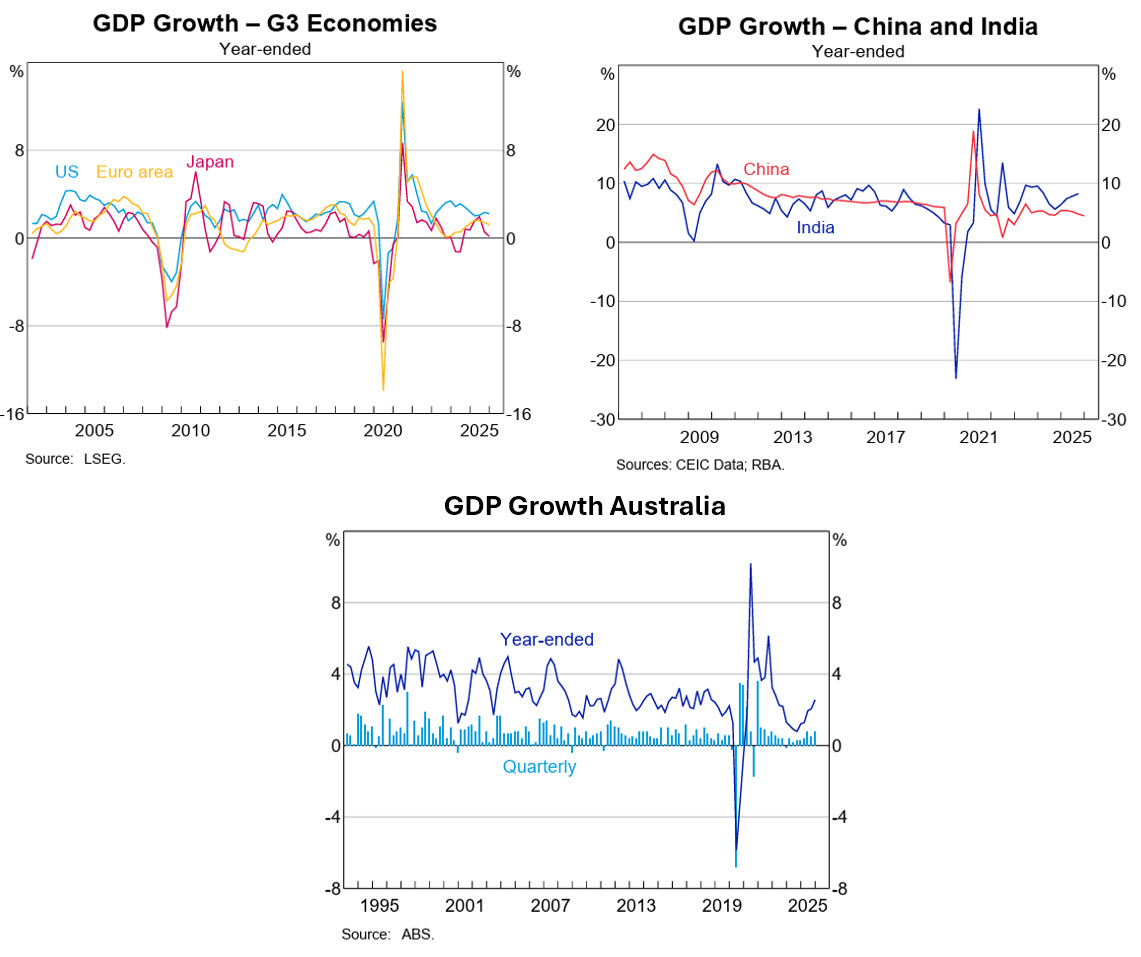
In the US, GDP initially came in at an annualised rate of 0.7% for Q4 2025, however this was further revised down to 0.5%, which was sharply down on the upwardly revised figure 4.4% of Q3 2025. The Q3 figure may have had some “guesstimation” issues due to the government shutdown and holes in reporting data. Either way, full year GDP was 2.1% for 2025, which was down on the 2.8% of 2024.
Consumer spending continued to be the largest contributor to growth, adding 1.33% to GDP, though this was a significant slowdown against Q3. Spending on goods and services eased, with the pullback in discretionary areas. Fixed investment was a bright spot in Q4, which helped offset slower consumption. Inventory accumulation added around 0.3% to growth, and reversed the drag from the prior quarters, this was due to firms rebuilding stockpiles after supply disruptions. Government spending knocked 1% off GDP, this was basically due to the Q4 federal shutdown, which saw a 17% drop in federal outlays and was the single largest contributor to the weakness in Q4.
The US labour market appears to be cooling with payroll growth slowing significantly. The unemployment rate itself is bumping around, November’s 4.5% figure was the highest reading since 2022, before falling to 4.4% in December and 4.3% in January, before up again to 4.4% in February. At the same time job openings have fallen below pre-pandemic numbers, with employer leverage increasing. Beneath this slowdown, however, the market remains structurally tight for certain skilled roles, with persistent hiring challenges in a handful of key sectors. Despite much weaker hiring, unemployment has not risen notably, because the economy now requires fewer monthly job gains to keep the rate steady, this is due to slowing labor force growth and lower immigration.
The January and February CPI figures were steady at 2.4%, matching expectations, they were also lower than the 2.7% readings of November and December. While positive, this is old news, and it was the March figure, released post quarter, that was of serious interest as it captured the spike in energy. March came in at 3.3%, the jump, as noted, was driven by energy costs, up 12.5%, with gasoline up 18.9% and fuel oil up 44.2%. Used cars and trucks saw declines, down -3.2%, food inflation eased, from 3.1% to 2.7%, while shelter inflation held at 3%. This was the highest CPI figure since May 2024.
Just to underline the potential inflation concern here, energy costs are felt well beyond transport. Higher oil and natural gas costs ripple through manufacturing, agriculture, and petrochemicals. Think plastic resins, fertilizers, and mineral processing, so the shocks go beyond fuel prices, not to mention supply constraints markets haven’t truly experienced yet. What starts as an energy challenge eventually becomes an inflation challenge. History suggests central banks will try to look through temporary energy shocks, but if higher prices persist the risk of rate rises increases.
In other US news, tariffs came back on the radar in February after a Supreme Court ruling that curbed the President’s use of emergency powers in trade policy. In a 6–3 decision, the Court ruled that the International Emergency Economic Powers Act (IEEPA) does not authorise the president to impose tariffs. As a result, all tariffs imposed solely under IEEPA are no longer legally valid, and US Customs and Border Protection ceased collecting those duties under the IEEPA. There’s now potentially tariff refunds on the way!
Source: RBA 2026
In the Eurozone, European Central Bank President Christine Lagarde said inflation was “in a good place” in February, but the inflationary threat posed by higher oil prices loomed for eurozone interest rates. While Interest rates were then kept on hold at the March meeting, Lagarde said the ECB could raise rates “at any meeting” if higher energy prices looked like causing an inflation surge.
Annual inflation in the euro area was 2.5% in March, which was up from 1.9% in February, according to estimates from Eurostat. The flash eurozone purchasing managers’ index indicated a slowdown in economic activity in March, with a reading of 50.5 compared to February’s 51.9. However, a reading above 50 still indicates economic expansion. France adopted a budget for 2026 during the quarter, ending months of deadlock. The budget aims to increase defence spending and reduce the deficit to 5% of GDP by the end of 2026 from 5.4% at the end of 2025.
Eurozone growth in 2026 is now expected to be modest, with increasing stagflation risks. The European Commission has warned that even a short-lived conflict could shave 0.4% off EU growth next year, while a more protracted disruption could reduce growth by up to 0.6% across 2026 and 2027.
In the UK, annual inflation eased through the quarter, although available readings didn’t include war affected March. After a spike to 3.4% in December to round out 2025, the January and February readings sat at 3%, both in line with expectations. After the Bank of England’s December rate cut, interest rates remained steady through the quarter, as the BoE unanimously voted to keep the Bank Rate at 3.75% in March 2026, though this was accompanied by a hawkish tone. In the early part of the quarter, markets anticipated interest rate cuts this year, but the change in bank sentiment has left the outlook for interest rates in the UK clouded, especially with rising energy prices. Politically, the Labour party and Prime Minister Kier Starmer saw a slight increase in his polling numbers after hitting a record low 18% favourability rating in the prior quarter, Starmer’s favourability inched up to 20%. At the same time, the Reform UK party led by Nigel Farage has started to see a decline in its voting intention from 29% to 24%. The Green party’s polling went past both the Labor and Conservative parties during the quarter, while February saw the launch of Rupert Lowe’s Restore Britian party, which coincided with its Mass Deportation policy. By late March Restore was polling at 6% according to Politico. Finally, data from the Office for National Statistics showed the UK economy grew by just 0.1% year-on-year in Q4 2025.
In Japan, Q4 2025 GDP came in at just 0.1% year on year, and down on the already downwardly revised 0.6% Q3 figure, this was the weakest number since Q2 2024. Core inflation, excluding fresh food but including energy, came in at 1.6% for February and down on January’s 2% reading, leaving February’s core figure the lowest since March. This was well below the Bank of Japan’s 2% target, offering little need to adjust interest rates, but at the BoJ’s March meeting (where interest rates remained unchanged at 0.75%) it warned that higher energy prices risk pushing underlying inflation higher. February saw a landslide victory for the LDP in the House of Representatives election.
In China, data showed full-year growth hit 5%, in line with Beijing’s target, this was helped by a record-high trade surplus as China continued to benefit from strong exports to non-U.S. markets, which helped offset tariff pressures. December retail sales were the slowest in three years, due to the prolonged property slump and deflationary pressures, despite ongoing consumer subsidies. Inflation remained subdued, although lumpy, with annual inflation at 0.2% in January, before hitting a three year high in February at 1.3%, but easing back to 1% in March. Food prices eased, up 0.3% against 1.7% in February, with a sharp slowdown in fresh fruit and vegetables and a fall in pork prices. Transport costs were up 0.9% against -0.7% in February, while falls in housing cost continued -0.2% against -0.2%. Meanwhile, the jobless rate stood at 5.1% for the third straight month. China’s biggest concern going forward is its exposure to the Middle East war with around 45–50% of its oil imports tied to Gulf supply. This makes it a potential supply risk rather than just a price shock. However, China does have large strategic reserves, can source via Russia and Central Asia, while transport electrification has limited near-term damage.
In Asia (ex-Japan & China) and Emerging markets, energy spikes can be positive for many emerging markets who export oil, but bad for oil importers, an example being South Africa which saw inflation concerns and currency depreciation. This outcome contrasted with what was seen through 2025, where oil prices were down nearly 20% and provided a healthy tailwind to emerging market energy importers. However, in the current conflict a blockade of shipping routes isn’t conducive to fully monetizing the benefits for exporters. While Saudi Arabia was able to divert some oil supply via its East-West pipeline, there was damage elsewhere to energy infrastructure, including Qatar’s Ras Laffan LNG facility. Elsewhere, Thailand saw some optimism as there were hopes that years of political instability could end with the election of the pro-business Bhumjaithai Party.
Back in Australia, data released in March showed GDP increasing by 0.8% for Q4 2025, below forecast and up on the upwardly revised Q3 figure of 0.5%. Year on year GDP growth end of Q4 sat at 2.6%, the strongest figure since 2022. GDP per capita, noted as a proxy for living standards, was up 0.4% for the final quarter of 2025, and up 0.9% for the year. CPI year on year was up 3.8% in January and 3.7% in February, which was consistent with the late 2025 figures, and well above the RBA’s target. The largest contributors to annual inflation were housing at 7.3%, and clothing and footwear up 4.9%. Transport eased again, down -0.2%, but this was pre conflict in the Middle East.
The elevated inflation readings forced the RBA’s hand in Q1, with the RBA increasing rates by 0.25% in its February and March meetings. It also put into question the wisdom of the rate cut back in August. At the March meeting, the board noted “a wide range of data over recent months have confirmed that inflationary pressures picked up materially in the second half of 2025. And “while part of the pick-up in inflation is assessed to reflect temporary factors, the Board judged that the labour market has tightened a little recently and capacity pressures are slightly greater than previously assessed.” It also highlighted inflation risks have tilted to the upside and is likely to remain above target for some time, so it was appropriate to increase rates.
As noted, with housing inflation, the government is becoming questionable in how it addresses Australia’s most pressing reason for housing demand: more people arriving in the country. The year to January 2026 saw the second highest net permanent and long-term arrival number of 494,540, while the year to February 26 was the third highest figure at 478,910.
According to Cotality data, House prices increased in every Australian market except the two major capitals, Sydney and Melbourne, which were slightly down in Q1. Overall, the combined capitals were up 1.8% and combined regionals were up 3.3% for the quarter. Sydney was down -0.2% for the quarter and up 4.8% annually. Perth 7.3%, Brisbane 5.1% and Adelaide 3.6% saw the largest increases over the quarter. On an annual basis, Perth was up 24.3%, with Darwin and Brisbane up 19.7% and 19% respectively. Melbourne again saw the lowest growth for the year, up 3.4%. For rents, the national vacancy rate fell to 1.5% in February, but moved up slightly to 1.6% in March. These are incredibly low vacancy rates, with the long-term average sitting at 2.5%. Rental growth was again strong, up 5.6% annually in the capitals and 6% in the regions.
Market Overview
Asset Class Returns
The following outlines the returns across the various asset classes to 31 March 2026.
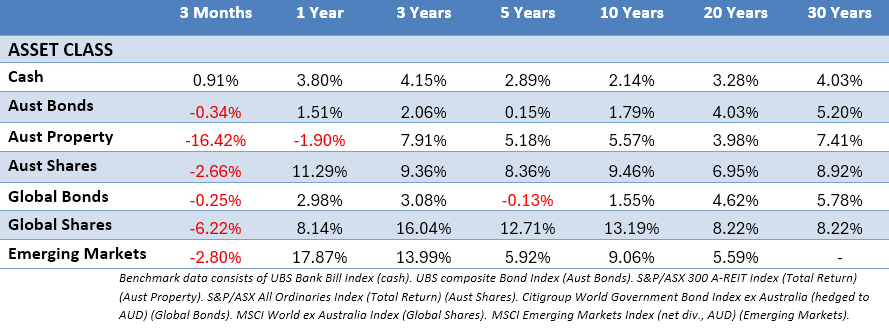
Global stocks saw red across the board in Q1 mostly due to the conflict in the Middle East. The Australian dollar moved higher across the quarter, from 67 to 69 cents USD, but saw a run up to spend much of February and early March in the 70-71 cent range. It also appreciated strongly against the Euro. The stronger dollar played a role in global returns prior to the start of the conflict. MSCI World ex Australia (Hedged) was down -3.31% for Q1, while the unhedged index was down -6.22%, a 50/50 split of the two was down -4.77%. US large caps were down 4.66%, while US small caps moved up 0.89%. Global stocks ex US (in USD) were down -0.94% for the quarter. After a very strong January and February, emerging markets gave back all their gains in March, to be down -2.80%, but still up 17.87% for the 12 months. Similarly, the Australian stockmarket was down -2.66% with March erasing a strong start in January and February. Australian listed property was down -16.42% in Q1, again reflecting the concentrated and volatile nature of the index.
Bonds also saw small losses as yields spiked due to the conflict, which pushed down bond prices. The 10-Year US Treasury yield started the quarter at 4.17% and was easing until late February, going under 4%, but spiked on the Middle East news to finish at 4.35%. US 2-year Treasury Note yields also spiked, shifting from the mid 3’s to hit 4%, before closing the quarter at 3.83%. In the UK, the 10-year Gilt moved up from 4.48% to 4.85%. In Australia, where inflation was already on the rise, the 10-year government bond yield moved up from 4.76%, to finish at 4.98%, clipping 5% at one point. While the 2-Year Australian government bond yield climbed throughout the quarter to close at 4.66%.
In the US, stocks were mixed depending on size and sector, and Q1 2026 felt a little familiar to Q1 2025, as the market swiftly pivoted from positive to negative. The S&P 500 was down -4.33%, with large caps lagging as the “Magnificent 7” declined sharply with increasing scrutiny around the payoff from the high AI capital spend. No surprise energy companies finished as the standout performers, as producers, refiners and energy infrastructure companies all benefited from higher oil prices. Basic materials companies, such as miners, chemical producers and commodity processors also did well due to their ability to sell products at higher prices amid supply disruptions. Infrastructure and utilities doing well reinforced that in a higher rate, policy constrained environment, earnings durability will be more important than expansion. The software sector was particularly hard hit with the evolving AI narrative creating a fracture within technology. Investors shifted to AI infrastructure businesses such as semiconductors, cloud computing and data-centre providers, and away from traditional software stocks. The concern here was generative AI could undermine the software-as-a-service subscription model the industry has relied on for years. There was a big scare that people would use AI to code their own software, leaving some software companies reeling.
Small caps, saw a strong start to the year with the potential for fed rate cuts and a belief the market rally would broaden beyond mega cap tech names, but like the rest of the market, small was punished in March. Early strength meant the Russell 2000 still notched a 0.89% gain for the quarter.
In the Eurozone, it was a similar theme, a positive January and February, before going backwards in March. The MSCI EMU was down -2.42% in EU terms. In France, the CAC 40 was down -4.08% for the quarter, while the German DAX was down -7.39%. The energy sector spiked on higher oil prices as the conflict affected both oil production and shipping. The harshest sell-offs were seen in the economically sensitive consumer discretionary sector. As elsewhere, there was divergence in the information technology sector. Software stocks came under significant pressure due to the threat of disruption by AI. In contrast, hardware and semiconductors fared better, seeing positive returns after positive corporate earnings.
In the UK, stocks performed well overall during Q1, with the FTSE All-Share index notching a positive return for the quarter, though mostly boosted by returns in January and February. Gains were supported by the relatively large weighting of the energy sector, while a weaker pound helped larger export-oriented companies. Basic material and telecommunications saw gains, while healthcare and large pharmaceutical stocks performed well due to robust corporate earnings and drug pipeline deals. The theme of punishment for tech and consumer discretionary was also consistent in the UK. Breaking down by size, the large cap FTSE 100 was up 2.46% for the quarter, while the small and mid-sized companies lagged. The mid cap FTSE 250 was down -5.63%, and UK small caps were down -4.28%.
In Japan, the stockmarket finished slightly up, with the TOPIX Total Return up 2.61% and the Nikkei 225 up 1.43% for Q1. There was a strong move upward in February after a landslide victory for the LDP in the House of Representatives election. This came with expectations of political stability and more pro-growth economic policies. However, as with all other regions, Japanese stocks suffered a pullback in March. Primarily this was due to the Middle East conflict and the resultant higher energy prices, and supply concerns, but to a lesser extent, there was concerns about private credit and lending to business development companies.
Asia (ex-Japan) and Emerging markets saw negative returns, with the MSCI AC Asia ex Japan Index down -4.42% in Australian dollar terms, while the MSCI Emerging Markets Index was down -2.80%. At an individual level, returns were driven by the large tech focused markets of South Korea and Taiwan, with strong performance coming from Latin American countries. India remained a drag with energy and overvaluations a concern. Initially Taiwan and South Korea led strong outperformance in January and February, supported by US dollar weakness, but the Middle Eastern conflict led to a sharp reversal in March with as high energy costs, supply chain disruptions and uncertainty hitting risk sentiment in South Korea, Taiwan and India who are all energy importers. Colombia, Brazil and Peru were the other top-performing markets in the quarter. Saudi Arabia also did well as the market benefited from rising oil prices. Chinese stocks were down in Q1 in response to slow domestic growth and weaker export demand. Indonesian stocks also fell after MSCI announced a temporary freeze on adding Indonesian companies to indices due to concerns about corporate transparency and ownership structures.
In Australia, the ASX 300 was down -2.04% in Q1, with almost as many sectors seeing a positive return as those in the red. As elsewhere the sectors were bookended by energy, up 36.1%, and information technology, down -27.21%. The market’s largest energy company, Woodside Energy was up 48% for the quarter, while Santos was up 29%. On the IT side, WiseTech continued its descent, down -44.46% in Q1 to sit at $38.02 at the end of the quarter, this is after climbing to a 2025 high of $120.50 back in July. Meanwhile, Xero continued to shed value, down 34% for the quarter, this was off the back of AI concerns and the potential for customers to clone its software and run their own tax software. Consumer discretionary, health care were the other sectors to see double digit losses, while utilities notched a double-digit return. Financials came in close to flat, up 0.43%. Finally, in contrast to the flat small cap returns in the US and globally, the ASX Small Ordinaries index were down -10.87% for Q1.
The Unexpected
With geopolitical tensions disrupting trade flows, hitting commodity markets, and heightening investor risk sensitivity, Q1 was another reminder that risk is often what you don’t see. Expectations in 2026 pointed to modest global interest rate cuts as inflation continued to ease from pandemic highs, this was expected to support equity markets and bond prices. Instead, it appears inflation will be our unwelcome companion for the near future, but this underlines the importance of discipline and diversification, with a portfolio structured to support long term objectives, while being robust enough to weather short term uncertainty.
This article is for informational purposes only and the information contained is of a general nature and may not be relevant to your particular circumstances. The circumstances of each investor are different, and you should seek advice from a professional financial adviser who can consider if particular strategies and products are right for you. In all instances where information is based on historical performance, it is important to understand this is not a reliable indicator of future performance. You should not rely on any material on this website to make investment decisions and should seek professional advice.
Foundation Wealth Planners ABN 84 612 059 622 is an Authorised Representative No. 1242404 and Credit Representative No. 488134 of FYG Planners Pty Ltd, AFSL/ACL No. 224543 ABN 55 094 972 540