Economic Overview
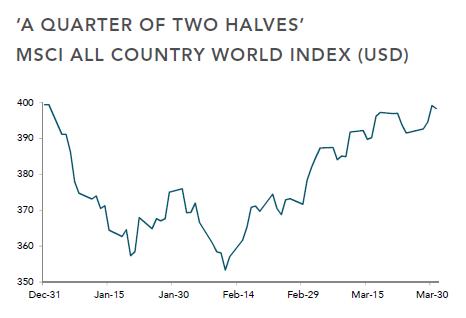
China, commodities and central banks were the focus for global investors in a volatile quarter that swung from fear about global growth prospects to relative confidence.
In China, data showed factory output growing at its slowest pace in eight years and investment at its weakest in at least five years. Beijing is seeking to transition the economy to a slower but more sustainable rate of growth, based less on investment and more on domestic consumption.

Both demand and supply concerns continued to weigh on commodity prices and emerging markets early in the quarter, but signals from the US Federal Reserve that it would proceed cautiously in raising interest rates helped revive risk appetites through March.
Highlighting the reversal of fortunes most dramatically was the turnaround in the price of crude oil. Having hit a 12-year low in early February near $US26 a barrel, US benchmark West Texas Intermediate futures rebounded to end the quarter at $US38.34, up 3.5%.
Boosting oil were hopes that the world’s largest producers, led by Saudi Arabia and Iraq, would act to curb a supply glut. As well, the US dollar reversed course from late January as the market wound back expectations for the pace of further US rate increases this year.
Commodity currencies led gains against the USD. Having hit a seven-year low below US69c in mid-January, the Australian dollar ended the quarter up 5% at US76.57c. More sizeable gains were made by Brazilian real, Norwegian krone and Canadian dollar.
The British pound was the worst performing major currency over the quarter, falling to seven-year lows against the USD amid uncertainty over how Britons will vote in a 23 June referendum on whether Britain should stay in the European Union.
The European Central Bank maintained its highly accommodative policy settings, announcing in March it was cutting all three of its main benchmark lending rates to record lows.
Market Overview
Asset Class Returns
The following outlines the returns across the various asset classes to the 31st March 2016.

Equity markets ended flat to mostly lower over the quarter, although the bounce in markets in March moderated the damage wrought in the unsteady start to the year. The rise in the AUD over the quarter meant larger losses for unhedged investors in global equities.
In the US, both the Dow Jones Industrial Average and S&P-500 ended modestly firmer for the quarter in USD terms. Commodity-related sectors such as metals and mining led gains.
Gold was a standout commodity performer, gaining more than 16% in its strongest quarterly performance in nearly 30 years. In turn Gold stocks were among the standouts in the US.
Likewise in Australia, gold stocks like Resolute Mining and Beadell Resources topped the tables. Industrials and utilities also were positive, though weakness in the heavyweight financials sector, including Macquarie Group and ANZ, helped push the overall market lower.
Fixed interest had a strong start to the year, wrong-footing forecasters who had said bonds were due for a pullback after the Federal Reserve in December raised interest rates for the first time in nearly a decade. A broad measure of global bonds rose about 3.7% in AUD terms.
SPIVA Scorecard for 2015
The end of the quarter saw S&P Dow Jones release their annual SPIVA Scorecard, which measures actively managed funds (the guys who pick stocks) against their benchmark indices. As is always the case, the SPIVA figures again show that the longer an investment timeframe the lesser chance an active manager will outperform their benchmark.
For general Australian equity funds, 63.78% of actives outperformed their benchmark (the ASX200), during 2015. Extending the timeframe out to three years and 55.18% of those funds outperformed the ASX 200, while across a five year period, 32.82% of funds outperformed the ASX 200. As you can see, the chances a fund will beat their benchmark over time progressively lessens.
If you were looking for global equity exposure and used an active manager, the figures were damning from the start. In 2015 only 27.73% of general international active funds outperformed their benchmark. Over three years the figure decreased to 13.30% and over five years only 11.76% of actively managed funds beat their benchmark.
The figures for Australian fixed interest and Australian listed real estate funds were equally as poor for active managers. For one, three and five year periods less than 15% of these funds managed to beat their benchmark.
It’s expected that over a shorter period volatility will play a larger part in returns. There’s also the element of luck over a shorter time frame that will explain active funds outperforming their benchmarks. Though as time goes good luck begins to run out and the ability to pick winners falls away along with returns. This explains the figures for Australian equities.
What isn’t expected is the consistently rotten returns from day one for active managers in international equities and Australian fixed interest and listed real estate.
And what shouldn’t be forgotten is the fact these active managers charge investors higher fees as they attempt to beat their benchmarks.
With thanks to DFA Australia.
This material is provided for information only. No account has been taken of the objectives, financial situation or needs of any particular person or entity. Accordingly, to the extent that this material may constitute general financial product advice, investors should, before acting on the advice, consider the appropriateness of the advice, having regard to the investor’s objectives, financial situation and needs. This is not an offer or recommendation to buy or sell securities or other financial products, nor a solicitation for deposits or other business, whether directly or indirectly.


