

Economic Overview
It was a quarter of all-time highs in Q2 2019 as both the US S&P 500 index and Australia’s ASX All Ordinaries achieved new highs, albeit with very different time frames between their past highs and their new highs. Most developed markets posted good returns during the quarter, despite some May declines. For the most part it seemed to be accommodating language from central banks helping underpin share market gains.
Uncertainty surrounding the US’ trade stance caused a May market wobble. However, investors were soon re-encouraged by continued dovishness from the Federal Reserve and indications of progress in trade tensions by the end of June. Comments from President Trump that his administration could impose tariffs on Mexican imports and extend the suite of goods that are taxed on import from China, caused a sharp market sell-off in May. In June, signs emerged of progress in talks with China, with Trump also “indefinitely suspending” the Mexican tariffs.
Eurozone Q1 GDP growth for was confirmed at 0.4% quarter-on-quarter. Annual inflation for June was stable compared to May at 1.2%. European Central Bank President Mario Draghi hinted that further monetary policy easing, such as new bond purchases, could be on the way if the eurozone inflation outlook fails to improve.

In the UK Theresa May resigned as leader of the Conservative Party and UK prime minister, taking a caretaker role on June 7th. The Conservative Party began the process of selecting its new leader. Despite a further extension of the Article 50 deadline to 31 October, there remains considerable uncertainty as to the path a new leader might wish to take. The negative impact of the original 31 March Article 50 deadline on the UK manufacturing sector became clearer. While GDP grew by 0.5% in Q1, in line with expectations, the Office for National Statistics revealed that the economy shrank by 0.4% in April, primarily due to a sharp fall in car production.
In Japan economic data was mixed, with the largest positive surprise seen in Japan’s growth rate for Q1 2019. This showed real GDP grew at an annualised rate of 2.1% whereas consensus expectations had called for a decline. The Bank of Japan left monetary policy, and the associated language, unchanged in the quarter.
In Australia, the LNP coalition surprised many pundits by retaining government during the May election. The election was followed by a sharp dose of economic reality as the Reserve Bank cut interest rates to a record low of 1.25%, noting domestic uncertainty stemming from household consumption. After being in a constant freefall since mid-2017, house prices appeared to stabilise in Melbourne and Sydney during June with 0.2% and 0.1% gains respectively for the month. Across Australia prices combined to fall 0.1% for the month and 1% for the quarter.
Market Overview
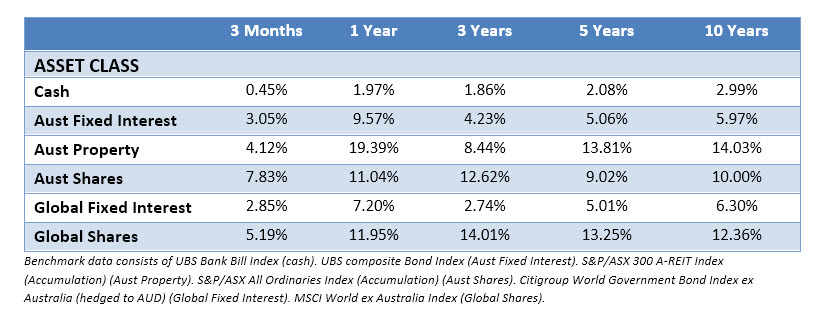
Asset Class Returns
The following outlines the returns across the various asset classes to the 30th June 2019.
US shares gained in Q2 and the S&P 500 set a new record high. More cyclical areas of the market, i.e. those that are most sensitive to the economic cycle, generally performed strongly. Financials, materials and IT all generated robust gains. Healthcare remains challenged by potential changes to pricing legislation, and more defensive (ie less cyclical) areas of the market made modest gains. Energy stocks largely declined.
Eurozone shares advanced in Q2 with a sharp drop in May sandwiched in between gains in April and June. Top performing sectors included information technology (IT), consumer discretionary and industrials. Sentiment towards trade-exposed areas of the market such as semiconductors and car makers ebbed and flowed over the quarter as trade tensions persisted. The lack of any further escalation in the trade wars in June helped the market to recover after May’s pull-back. UK shares also performed well. Areas of the market perceived to offer superior and defensible earnings growth extended the run of outperformance they have experienced since the beginning of 2019.
Japanese shares performed worse than the other main developed markets in the second quarter. The total return for the three months was -2.4%, primarily as a result of weakness in May. The yen strengthened against other major currencies, driven partly by its perceived safe-haven status at times of geopolitical risk, and partly as a result of changing interest rate expectations for the US.
Emerging market shares recorded a slight gain in a volatile second quarter. US-China trade tensions were rekindled in May as talks unexpectedly broke down, and both sides implemented new tariffs. However, hopes for a resumption of talks post the G20 summit in June, and rising expectations that the US Fed will cut interest rates, proved supportive later in the period. The MSCI Emerging Markets Index gained but underperformed the MSCI World.
Back in Australia, the price index of the ASX All Ordinaries reached its highest point in nearly 12 years. The Australian market was among the top performers globally, returning nearly 8% over the quarter and more than 11% for the financial year. The iron ore price continued to power the shareprices of major miners, BHP, Rio Tinto and Fortescue, while the market’s big dividend payers staged a relief rally in May as the prospect of Labor’s dividend imputation changes went away with Labor’s failure to win the Federal election.
Additional material sourced from Schroders and DFA Australia.