


Economic Overview
As in the previous quarter, the major theme of the June quarter was COVID-19. In contrast to the punishment investors took in the March quarter, the June quarter provided some relief. Investors saw market rallies that partially countered some of the steep falls of the previous quarter. The easing of COVID-19 lockdowns, patchy potential signs of economic recovery, along with unprecedented government stimulus and central bank intervention saw risk appetites return rapidly.
In the US, early data confirmed the severe economic impact of lockdown measures. However, weekly claims for unemployment insurance slowed significantly with retail sales rebounding strongly from April to May. Notably, after two interest rate cuts in March, chair of the US central bank, Jerome Powell, bluntly stated the Federal Reserve is “not even thinking about thinking about raising rates”. Investor optimism was dimmed late in the quarter by a rise in COVID-19 cases. Across the US the trend of new cases accelerated rapidly into the end of June. The states of Texas, Florida, California and Arizona saw large increases in cases and hospitalisations.
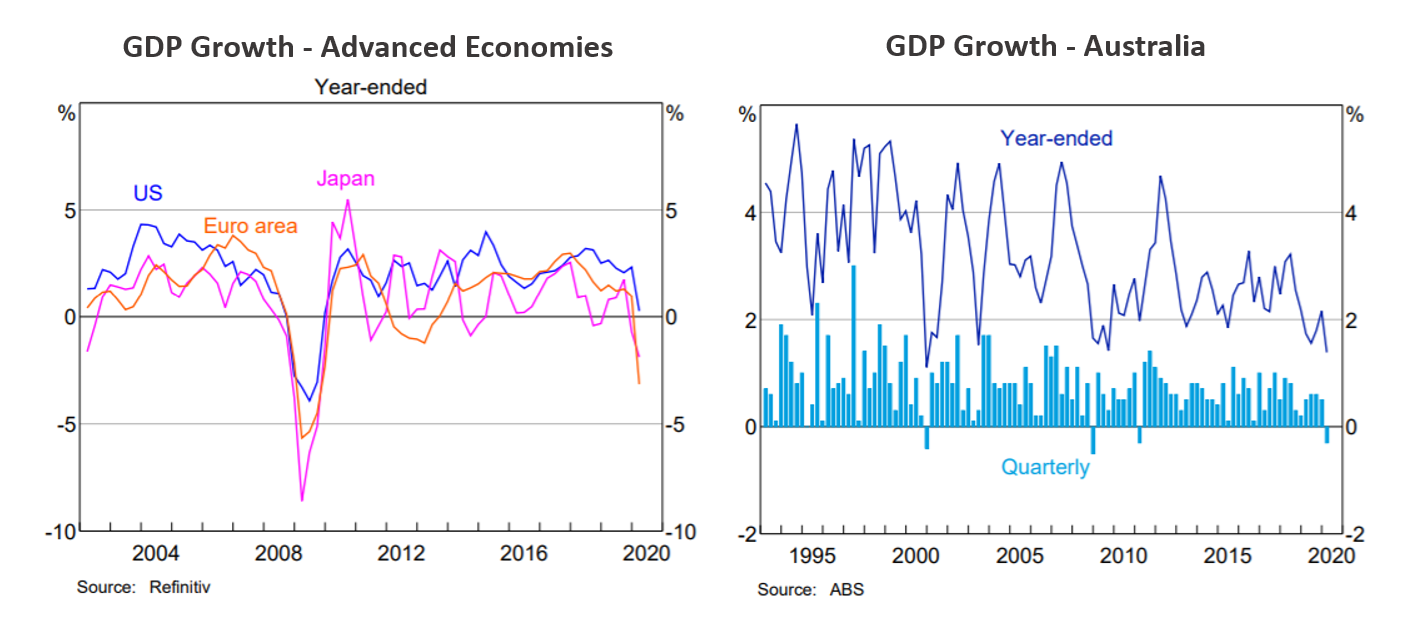
In the EU, data showed the economy shrank by 3.6% in the March quarter, against the final three months of 2019, this after lockdown measures were introduced. However, economic activity surveys showed significant improvement through the June quarter. The Eurozone composite purchasing managers’ index (PMI) swiftly recovered April to June, from 13.6 to 47.5 (50 separates expansion from contraction). The Baltic countries (Estonia, Latvia & Lithuania) along with Austria, were among the first to loosen lockdowns in the EU after successfully containing the virus. The success of the three Baltic countries resulted in a travel bubble between the trio. Worse affected countries such as Spain, France and Italy waited until later in the quarter before relaxing measures.
In the UK, monthly estimates showed the economy contracted by a record 20.4% in April (the first full month of lockdown). However, Google mobility data highlighted work-related travel also bottomed in April. The view is GDP could have returned to positive growth in May. The cost of the government programs announced in the March quarter pushed the UK debt to GDP ratio above 100% for the first time since the 1960’s.
In Japan, new COVID-19 cases peaked in mid-April before falling away in May and June, before a spike in the final few days of the quarter. A state of emergency was declared by the government across seven prefectures on 7 April, which was later extended nationwide. The state of emergency was fully lifted by 25 May. The Japanese government stepped up its fiscal response to the crisis with a second supplementary budget, as expected, while the Bank of Japan also announced additional monetary policy initiatives.
In China, economic activity continued to recover, with manufacturing PMI improving in June, though exports fell by 3.3% year-on-year in May after expanding in April. The government announced further fiscal support at the National People’s Congress in May. It was China’s geopolitical moves that were the most interesting. The US-China confrontation expanded beyond trade and technology, the new Hong Kong security law was implemented at the end of June, while there was a skirmish with India on the disputed Himalayan border.
Back in Australia, it was almost a positive to see March quarter GDP contract by only 0.3%. This included much of the fallout from the bushfires and early COVID restrictions. Having cut interest rates to a record low of 0.25% in March, the Reserve Bank continued with its government bond buying program, reaffirming it “will do whatever is necessary to ensure bond markets remain functional.” The biggest interest in Australia now are loan deferrals. 800,000 loans are in deferral, including 480,727 home loans, totaling $173.4 billion.
Market Overview
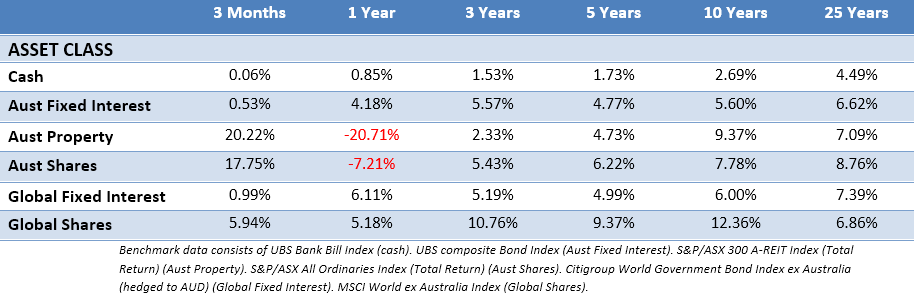
Asset Class Returns
The following outlines the returns across the various asset classes to the 30th June 2020.
The June quarter saw a strong turnaround in stockmarkets throughout the world. Many were confused by the strength of the rally, but if someone were looking for an explanation it is likely a combination of government and central bank stimulus along with the reality that markets are known to overreact both negatively and positively. In addition, low rates on cash and bonds means some investors are forced to take additional risk and cling onto any shred of good economic news to hold stocks.
US stockmarkets outperformed other major markets. With Improving jobs and retail sales data providing cause for optimism. Loose monetary policy from the Federal Reserve and early indications of a recovery led to widespread equity market gains. Gains were tempered towards the end of the quarter as virus numbers worsened. Retail sales figures supported consumer discretionary stocks, which outperformed, along with the consistently resilient information technology space. Energy and materials also made strong gains. More defensive areas such as utilities and consumer staples struggled.
Eurozone stocks were strong, a source of support being EU’s plans for recovery. The European Commission president called for the power to borrow €750 billion for a recovery fund to support the worst affected EU regions. This on top of a €540 billion rescue package agreed upon in April. The European Central Bank also offered support, expanding its pandemic emergency purchase programme to €1.35 trillion.
In the UK, economically sensitive areas of the market outperformed as investor sentiment improved with the global outlook. The mining sector, performed very well, in part due to the ongoing recovery in Chinese economic activity and new stimulus measures.
The Japanese equity market recorded a low double digit return. Investors reacted positively to global news rather than specific Japanese pandemic news. As a result, economically sensitive and global stocks, together with pharmaceuticals lead the market recovery. Domestic sectors such as transportation, insurance and utilities lagged behind. Airlines continued to weaken as concerns mounted over their inability to restart profitable services.
Asia ex Japan markets recorded a strong return in the June quarter. There were exceptions. China, which slightly unperformed after a stronger relative March quarter, and Hong Kong where geopolitics and the new security law loomed.
Export-oriented markets such as Indonesia, Thailand and Taiwan outperformed the regional index as investors looked to recovering global demand in the second half of 2020. Indonesia also benefited from strong currency appreciation. India’s central bank provided additional support in April which was followed by the announcement of a major fiscal stimulus package in May.
In Australia, the ASX saw its best quarter since 2009, but keeping things in perspective, that was off the back of the worst quarter since 1987. The strongest performers in the recovery were the information technology, mining and materials, consumer discretionary and telecommunication sectors. Healthcare and consumer staples maintained their strength, while industrials, financials and energy continued to lag the broader market.
From an Australian perspective looking globally, unhedged international stocks suffered as the Australian dollar strengthened with the recovery. While the MSCI World ex Australia index returned 5.94% for the quarter, their hedged counterpart returned 17.82%. Showing it’s not only important to widely diversify, but partial hedging can also play a part in lowering volatility within a portfolio.
Finally, a tale of best and worst returns on a monthly basis over the 19/20 financial year.
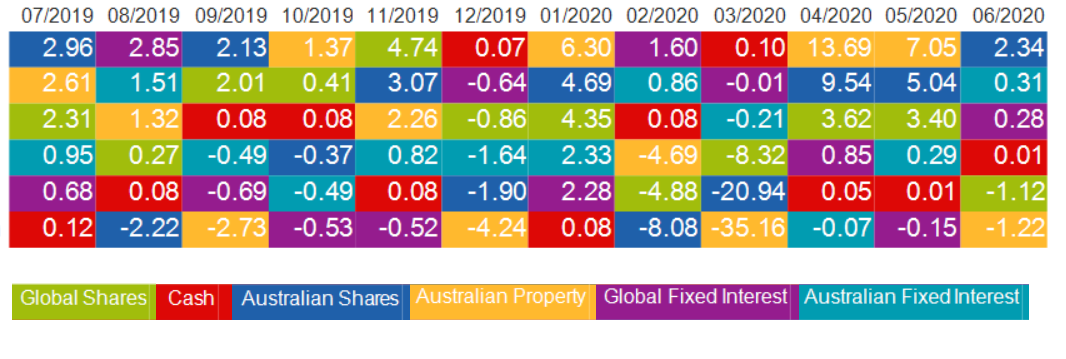
As always, there’s no clear pattern or clue on how asset classes will perform. Remaining diversified, means capturing some of the upside while minimising some of the downside.