


Economic Overview
Attention turned to vaccinations and reopening economies in the second quarter of 2021, by the end of the quarter over 3 billion vaccine doses had been administered globally. There are now strong indicators of a robust and lengthy economic expansion ahead. Around the world there are now businesses desperate to hire new employees, millions of consumers with money burning holes in their pockets, and ongoing fiscal and monetary support from governments and central banks.
In the US, the positive news around COVID was vaccinations. While President Biden had set a goal of 70% of all adults vaccinated by July 4, analysis by The New York Times in late June suggested the US would fall short, with around 67% of adults partially vaccinated. The Centers for Disease Control and Prevention (CDC) figures showed 45% of Americans had been fully vaccinated near the end of Q2. The laggards were those aged between 18 and 26. The negative news was the Delta strain of the virus. Delta is more contagious and according to the CDC was accounting for over 20% of US cases at the end of June.
The increasing vaccination rate is contributing to the resumption of travel and dining out across the US. Various data points have shown restaurant traffic back to, and even above, pre-pandemic levels. Air traffic remains 24% down and hotel occupancy down 10%, but significant progress has been made across the quarter. Since March, the US economy added 1,702,000 jobs and net growth in payrolls since last May 2020 totals 15.6 million. In late June, President Biden also secured a deal on a $1 trillion infrastructure package to upgrade roads, bridges and communications networks.
Late in the quarter there was some panic around potential responses to inflation as the Federal Reserve’s Open Market Committee unveiled unexpected rate hike projections for 2023. These were accompanied by increased inflation and economic projections for 2021. However, Fed Chair Jerome Powell attempted to dampen the hawkish forecasts by noting much progress is still needed and future changes to the asset purchase program will be “orderly, methodical and transparent.”
In the Eurozone, the pace of vaccine roll-out accelerated as many countries saw COVID cases fall through the quarter. Falling cases combined with increasing vaccination rates saw social and economic restrictions loosen. Economic data was positive and pointed to a strong rebound in Q2. The flash Markit eurozone composite PMI rose to 59.2 in June, this was its highest level since 2006. Eurozone inflation was estimated at 1.9% in June, down from 2.0% in May. The European Commission signed off on the first of the national recovery plans which will receive funding from the €800 billion Next Generation EU fund. This forms part of the largest stimulus package ever in Europe, a total of €2.018 trillion. The first countries to have their spending plans approved under the Next Generation fund were Spain and Portugal.
In the UK, the vaccine rollout stood at 65% of the population with at least one dose by the end of Q2. The Delta strain of the virus saw the UK government postpone the final easing of lockdown restrictions until 19th July. Economic data continued to highlight a robust recovery. Retail sales rose by 10% in May compared to the pre pandemic measure of May 2019. The Bank of England (BoE) increased its GDP growth forecast for 2021 to 7.25% from the 5.00% it predicted in February. The Bank of England left monetary policy unchanged in June and sought to calm fears over rising inflation. The Bank acknowledged that inflation would rise but suggested the surge in prices was transitory and should not affect monetary policy.
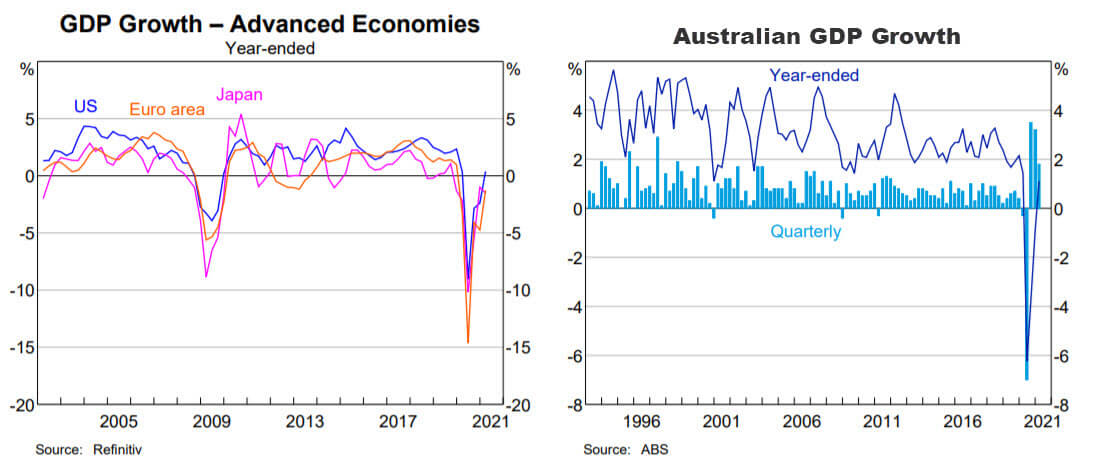
In Japan, vaccination rates increased in May getting past some of the hurdles seen in the previous quarter, but were still slow. Though infections were lower than in many other countries, cases continued to grow, leading the Suga government to delay lifting the state of emergency until June 20. Industrial production was weaker than expected, the primary reason being a slowdown in auto production caused by the global shortage of semiconductors.
China saw factory activity fall in June as raw material costs and the semiconductor shortage began to bite. While year on year GDP growth was 18.3% in Q1, this was expected to fall back into single digits in Q2 as most of China’s recovery has already occurred. Chinese manufacturing PMI slipped to 50.9 in June versus 51.0 in May. Consumer spending has been sluggish, with figures showing household expenditure lagging disposable income as Chinese consumers continue to save.
Emerging market countries saw a particularly severe third wave of covid infections. Vaccinations generally lagged developed markets as emerging market countries struggled to procure developed country vaccines. Despite spike in virus cases, the Brazilian economy rode the booming global demand for iron ore and copper, along with agricultural commodities. The Russian economy benefited from agricultural demand despite ongoing political frictions with western countries. Higher oil prices were also supportive in Russia, along with Saudi Arabia.
Back in Australia, data released in June showed the economy grew 1.8% for Q1, with year-on-year growth at 1.1%. The household saving rate also increased to 12.2% showing some caution from consumers, but also a capacity to spend. Q2 also coincided with the end of the JobKeeper program, with the economy seemingly having no problem digesting the withdrawal of support. The unemployment rate fell to 5.1% in May. On the virus front, Australia was somewhat of a victim of its own previous success when it came to getting the population vaccinated. The reports of blood clotting from AstraZeneca recipients in Q1 led to public hesitancy and changing advice around the vaccine. Notably, there was no countrywide vaccination awareness campaign from the Federal Government, while PM Scott Morrison suggested getting vaccinated “was not a race”, indicating the government may have been at ease with a longer-term border closure.
In its June minutes, the Reserve Bank noted it would “maintain highly supportive monetary conditions until its goals for employment and inflation were achieved.” And it “would not increase the cash rate until actual inflation is sustainably within the 2 to 3 per cent target range” something the board highlighted would require significant wages growth to occur.
Market Overview
Asset Class Returns
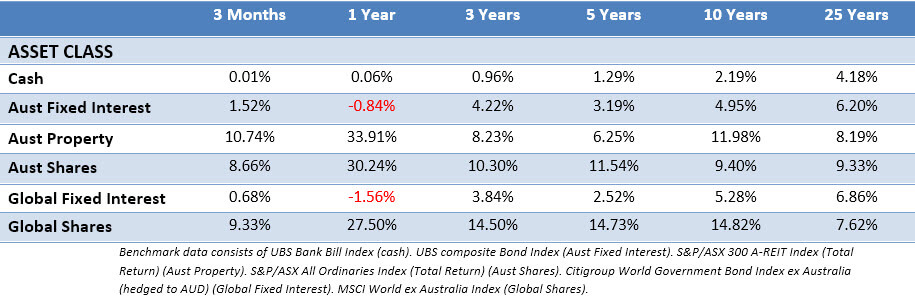
The following outlines the returns across the various asset classes to 30th June 2021.
Global sharemarkets delivered strong returns in Q2, while yields fell in longer dated bonds in the US and UK, reversing some of the sharp upward moves of Q1. The 10-Year US Treasury yield declined from 1.74% to 1.47%, while the UK 10-year yield fell from 0.88% to 0.72%.
In the US, the S&P 500 and NASDAQ reached a new all-time high in late June, with nearly all sectors notching gains over the quarter. The tech titans such as Apple, Alphabet (Google) and Microsoft made strong gains over the quarter. Notably, Facebook joined Apple, Microsoft, Amazon, and Alphabet (Google) in the exclusive $1 trillion market-cap club. By sector, energy, IT, communication services and real estate were amongst the strongest areas of the market. Utilities and consumer staples were the laggards.
Eurozone shares advanced in the quarter, supported by a strong corporate earnings season and an acceleration in the pace of vaccine roll-out in the region. The top performing sectors were defensives, areas such as consumer staples and real estate, which had lagged in Q1 as investors focused on more economically sensitive areas of the market. Information technology was also strong, while utilities and energy were laggards. As noted, earnings for Q1 were robust across the board, with healthcare the exception.
UK shares were largely driven by lower valued and economically sensitive sectors during April and May and as sentiment improved, global investment managers reported being “overweight” the UK for the first time since 2014. However, June was a different story amid a rise in Covid-19 infections and falling inflation expectations. Defensive large cap companies were resilient in June, particularly healthcare and consumer staples. Energy also performed well in June, while financials were poor.
The Japanese market fell during Q2 despite a decent corporate results season where the majority of companies reported inline, or slightly ahead of expectations. The number of companies reporting profits below expectations has been significantly lower than normal.
The rest of Asia was mostly positive in the Q2 as investors were optimistic about economic normality. However, returns were tempered towards the end of the quarter due to a resurgence of Covid-19 infections and lockdowns due to the Delta strain. The stronger US dollar also weighed on June returns. The Philippines was the strongest index market in the quarter, while Taiwan and India also achieved positive gains during the quarter. By contrast, Pakistan, Indonesia, and Thailand all struggled as rising Covid-19 infections weighed on their respective markets.
The Australian market (All Ords Accumulation) notched a 8.66% return for the quarter. Sector strength was similar to the previous quarter, coming from financials and consumer discretionary, although most sectors posted gains. Over the financial year, consumer discretionary led the way with 42% return, followed by financials at 39% and financials 35%. Utilities continued their poor run in Q2 and were the poorest performing sector in the year to June 30, down 23%.
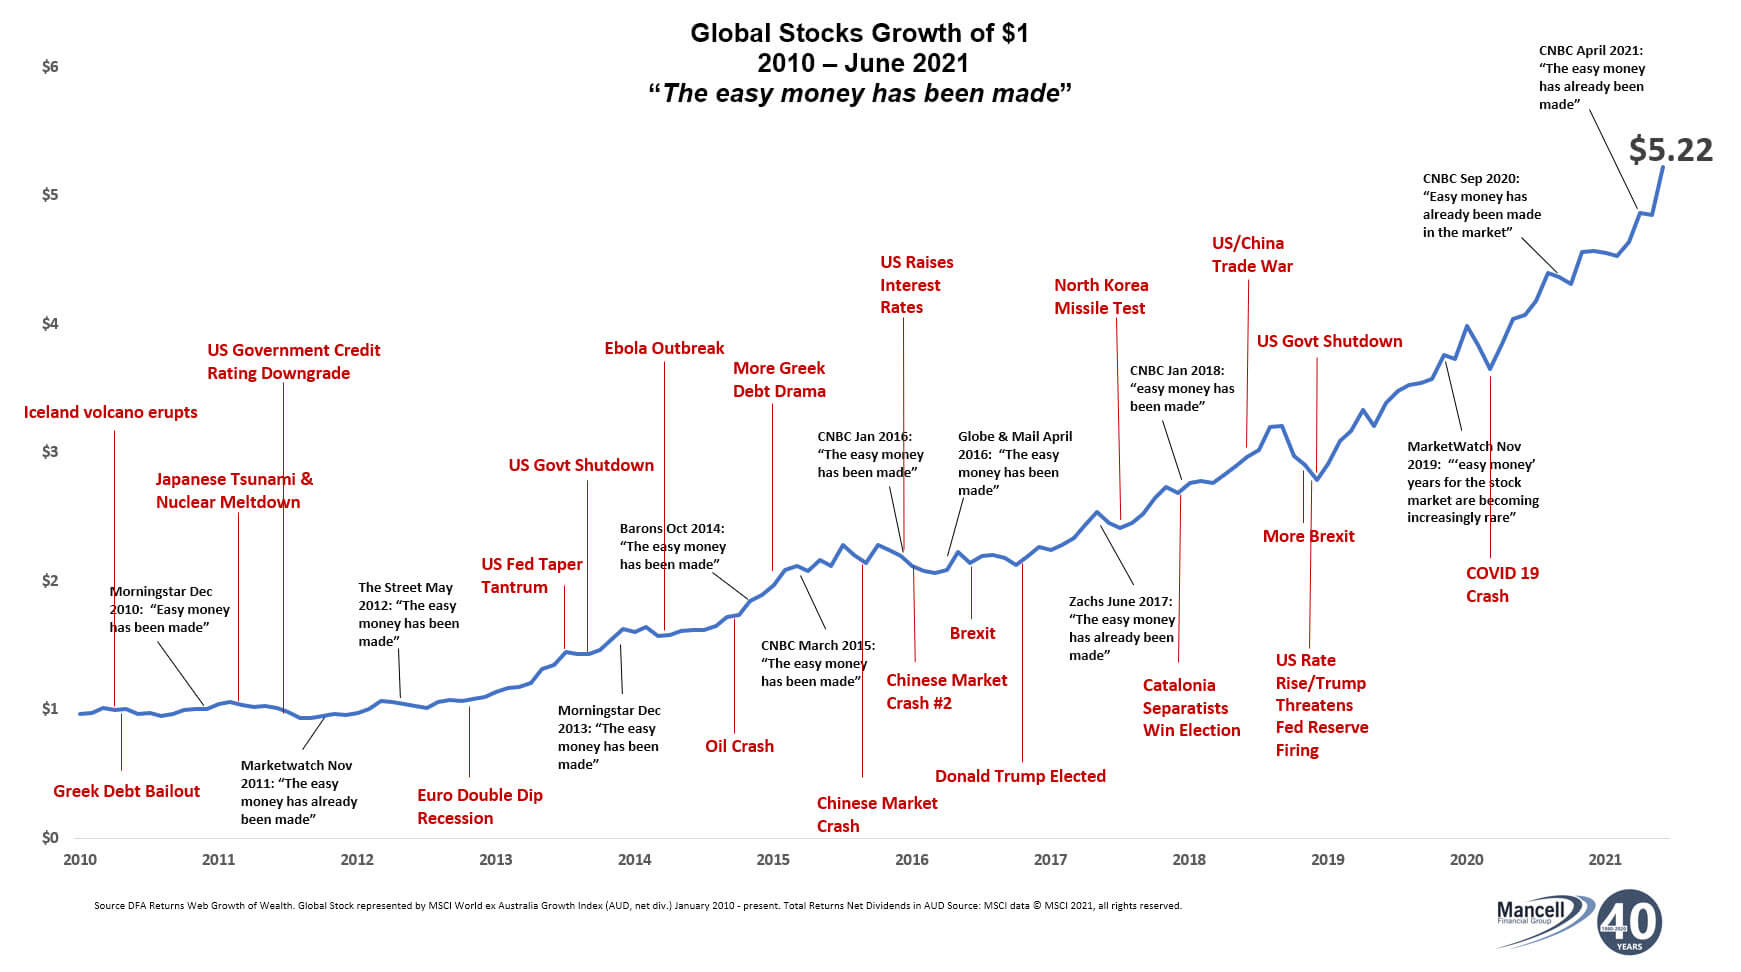
The Easy Money…
One of the ongoing challenges of investing is to set aside the distractions of the “here and now” to focus on the long term where true wealth is usually made. Not only do investors have to digest real events that seem concerning in the moment, but they also need to block out the commentary from market watchers that can shape opinions about what the future holds.
One of the regular lines trotted out in the financial media is how “the easy money has been made”. We’ve plotted several of these calls on a chart that tracks the growth of $1 invested in global stocks over the past 12 years. For some more context, we’ve added in a few concerning historic events in red. $1 in January 2010 turned into $5.22 at the end of June 2021. This, despite calls “the easy money had been made” 13 times.
While there’s no easy money in financial markets, the easiest money is often made by looking beyond concerns about the present, ignoring narratives about the future, and doing nothing.
This article is for informational purposes only and the information contained is of a general nature and may not be relevant to your particular circumstances. The circumstances of each investor are different, and you should seek advice from a professional financial adviser who can consider if particular strategies and products are right for you. In all instances where information is based on historical performance, it is important to understand this is not a reliable indicator of future performance. You should not rely on any material on this website to make investment decisions and should seek professional advice.
Foundation Wealth Planners ABN 84 612 059 622 is an Authorised Representative No. 1242404 and Credit Representative No. 488134 of FYG Planners Pty Ltd, AFSL/ACL No. 224543 ABN 55 094 972 540