The ‘active versus passive’ debate in funds management is a guaranteed space filler in the financial media, but it would help the general public if those making the comparisons got their facts straight.
A recent article in Professional Planner by John Peterson of the Peterson Research Institute cited the outperformance of Australian Super’s actively managed balanced option and a passively managed indexed diversified option to justify the argument that actively managed funds do better over time than their passively managed equivalents.
Stop the Press. This is news to us. So we looked in detail at these two vehicles and discovered that while Mr Peterson goes into detail to highlight the similarity between the two. Noting the ‘virtually identical’ investment horizon, risk of negative return and long-term objective, he seems to have ignored one incredibly significant detail.
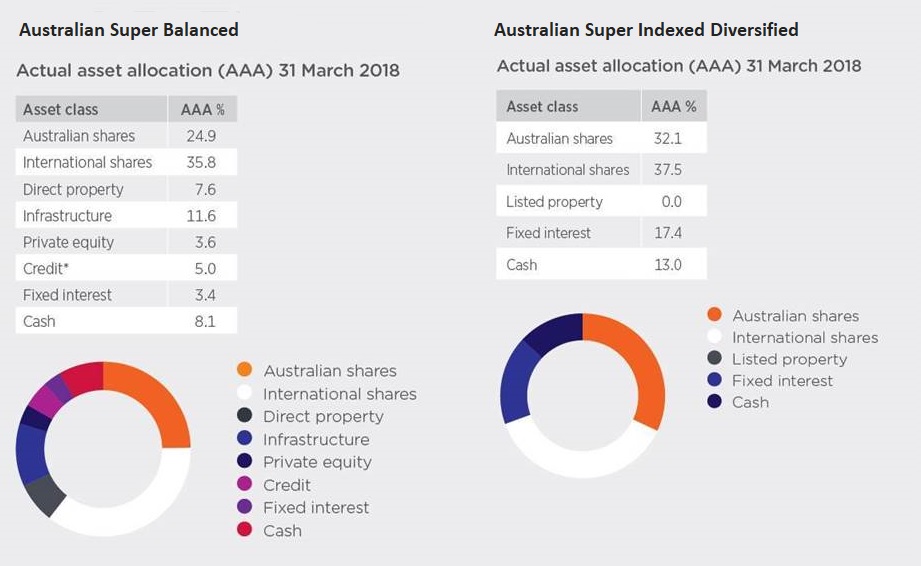
There’s no allowance for the relative asset allocations of both funds being compared. And if you believe the academics, asset allocation explains around 93.6% of the variation in portfolio returns. With that being the case, it’s a none too small and frankly strange omission.
Bringing up the asset allocation tables from the most recent disclosures available from Australian Super shows it’s not even an apples with oranges comparison. Something closer to apples with potatoes.

On one hand, the actively managed Balanced option shows a very aggressive asset mix, with growth assets comprising almost 85% of the portfolio. On the other, the Indexed Diversified Option has slightly under 70% of the portfolio allocated to growth assets.
Then there’s the breakup of those asset classes into broad categories. The Balanced option is holding eight broad asset classes, while there are only four in the Indexed Diversified fund.
In his article Mr Peterson boldly states, “the outperformance of the actively managed Balanced option is not surprising.” This is where we absolutely agree. It’s not surprising, but it’s nothing to do with active vs passive. This is solely an asset allocation discussion because the substantial difference in the underlying assets has, and will continue to, drive the variance in returns between these two funds.
How this comparison was made in the first place leaves us scratching our heads. Australian Super itself doesn’t appear to be making any suggestion these are competing funds. It appears to be an arbitrary comparison that’s done with some cherry picking in mind.
It’s understandable that those with a vested interest in a particular style of management will defend their corner, but the fact is the general investing public is not interested in these endless turf battles.
What matters for them is the risk-adjusted returns they receive in their pockets after fees and after taxes. If we start from there, work backwards and examine how assets are allocated we can explain the vast bulk of returns, irrespective of the supposed investment style.
Finally, after looking at the asset allocations we’re left with another head scratcher. How does Australian Super manage to call its Balanced Option ‘balanced’ when it’s holding 80%+ growth assets? But that’s a conversation we’ll have in the coming weeks.


