


It’s one of the most vexing finance questions there is. While it seems like a straightforward one, it’s really a question that only invites further questions. Not about the money, but about the person or persons who are retiring. There will never be a one-size-fits-all pot of money. Primarily because of how many different variables come into play.
What do you want to spend?
Will your spending change?
What your returns will be?
What is the sequence of those returns and how volatile will your portfolio be?
The first two questions are the most controllable. Everyone will have fixed costs based primarily on their shelter, transport, food, clothing and possibly healthcare. These can be elastic to a point. There may also be bigger ticket items that need addressing along the way. It’s a heroic assumption to assume a 30-year retirement will chug along without a repair to a house or an appliance replacement. There are other living related costs we may have the ability to tweak such as entertainment and holidays, depending on lifestyle demands.
The second two questions aren’t controllable and they’re not even knowable. The best anyone can do is assess the range of historical outcomes from various portfolios and make a choice based on the risk they are willing to bear to achieve their spending goals.
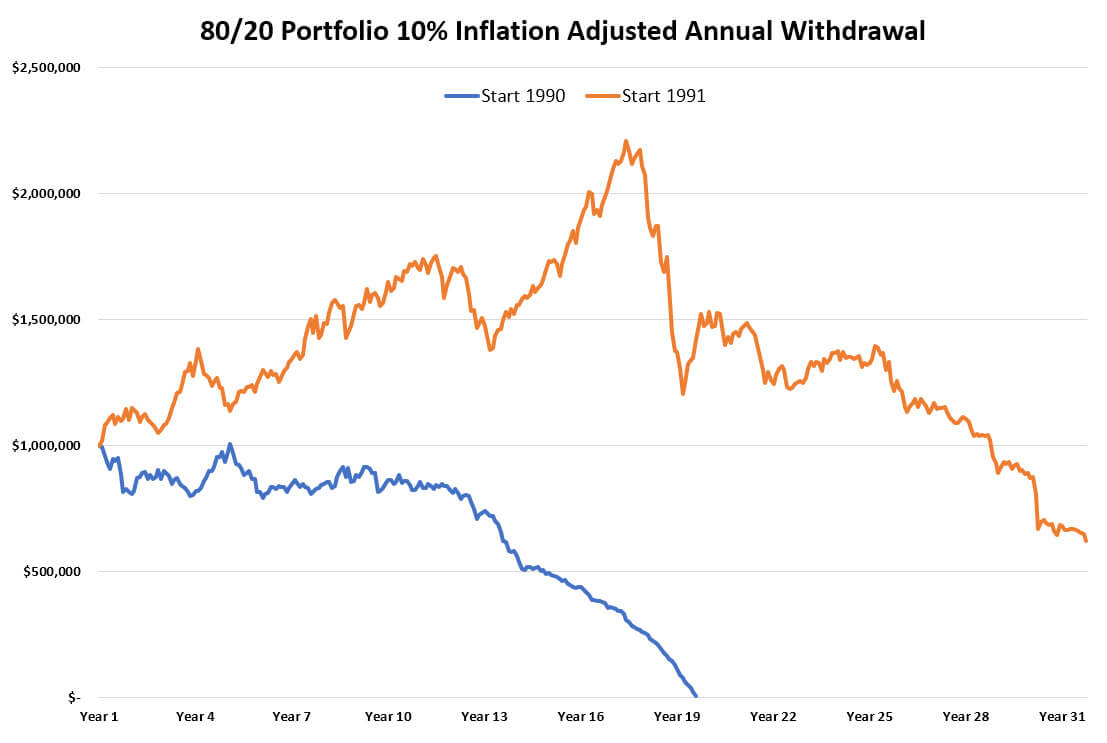
This is where the dollar figure comes in, but it needs to be paired with a sensible withdrawal rate. If you’ve got $1,000,000 and you want to spend $100,000 a year for 30 years, you can certainly try, but you’ll need a lot of good market fortune early in the piece for the portfolio to compound and outpace the withdrawals. A 10% withdrawal rate is doable, but it’s not advisable.
For example, if you tried this using a million-dollar portfolio with 80% in growth assets starting in January 1991, today you’re left with $622,000, after withdrawing $4.4 million along the journey. Proving it can be done, but if you tried this starting exactly 12 months earlier your portfolio would be exhausted in 2008.
There are inevitable questions here. The big one is the aggressiveness of the portfolio. It’s a brave retiree who charges into retirement holding 80% of their portfolio in shares and real estate. It’s an even braver one who draws 10% of the portfolio annually adjusted for inflation, so there’s really no choice about increasing risk. It must be done. A 10% withdrawal rate must aim for something higher than a 10% annual return, and that’s not feasible by being heavy in cash and bonds. Start with a less aggressive portfolio in 1991 and it’s exhausted earlier than 30 years.
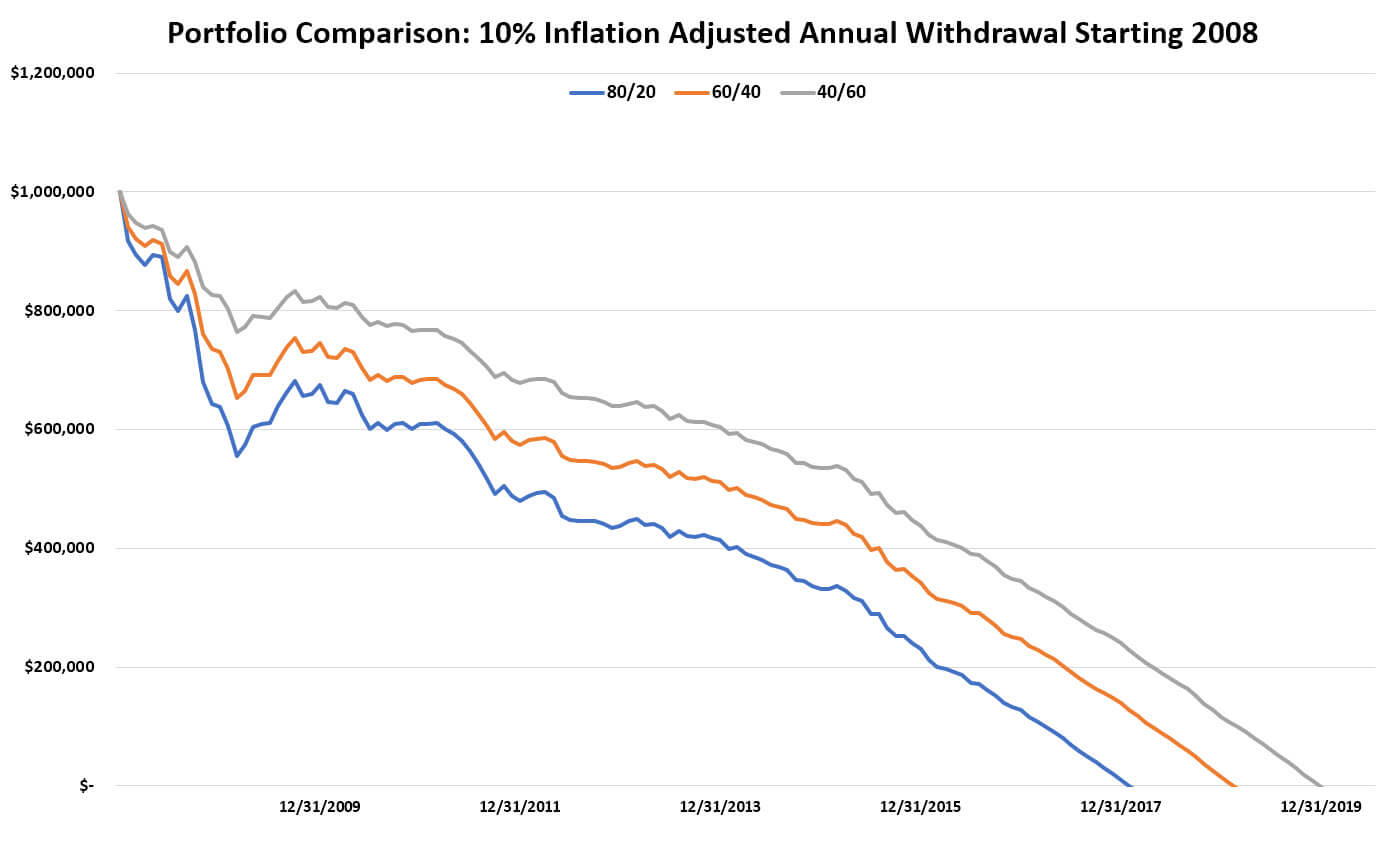
Even so, these are very optimistic scenarios. Getting 19 years or even 30+ years starting with a 10% withdrawal rate should be considered best case outcomes. Using a very unwelcome event offers the most sober assessment. Try this in 2008 with the financial crisis and you would have been lucky to get ten years out of any portfolio while withdrawing 10%.
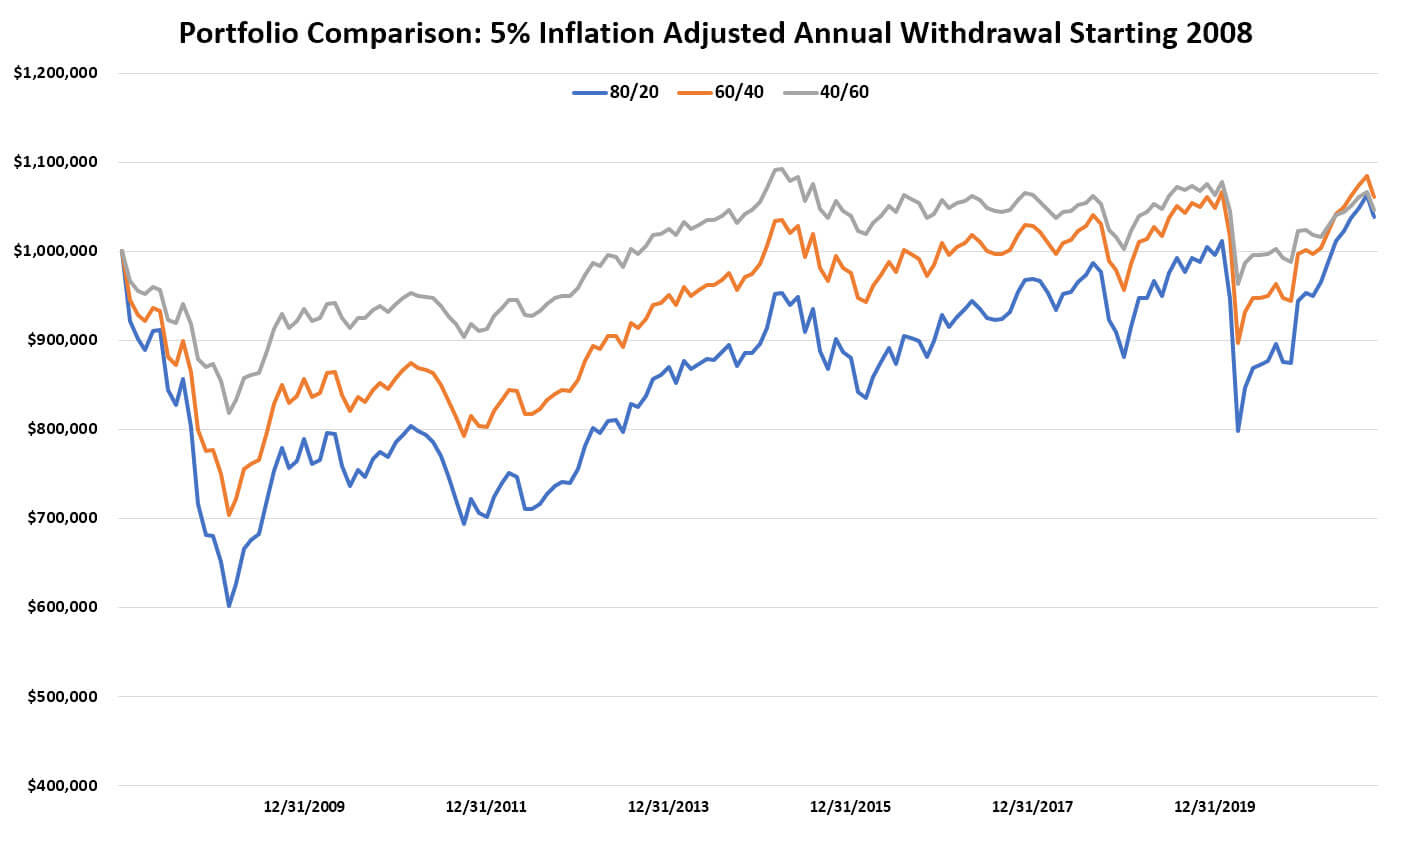
Going back to the original questions, it’s the “what do you want to spend” that’s more in a retiree’s control, so how does a 5% withdrawal rate look?
Much better. Starting from one of the worst possible times, no matter whether a portfolio was an aggressive 80% in growth assets, a middle of the road 60%, or a more conservative 40%, by well into 2021 all were above their initial starting position. And the most important thing, all had provided more than $800k in retirement spending.
The outcomes above are also factored on monthly withdrawals. Run them again annually, or biannually, and they present different results again. The long-time rule of thumb is a 4% withdrawal rate should ensure certainty of inflation adjusted spending from a 60/40 portfolio over 30 years. Recently this has been brought into question. Low returns from bonds and lower expectations going forward from shares, after some strong returns in recent years, have prompted suggestions 3.3% is the new safe withdrawal rate.
Which is it?
A 10% withdrawal rate will be more luck than common sense. A 5% withdrawal with a bad start followed by a decent tailwind can get you 15 years with your principle intact, whether it makes it another 15 years is unknown. A 4% withdrawal will look even better to weather rougher seas. What about a 3.3% withdrawal rate?
Wouldn’t a 2.3% withdrawal rate look even better? It would, but at some point, you need to settle on a feasible amount to live and enjoy life! No matter what is chosen, a retiree is always heading into the unknown. The focus shouldn’t be 4% or 3.3% because life doesn’t exist on a spreadsheet. It should be what leads to getting the most out of life. The scenarios used earlier have multiple different inputs, but they’re also static in their withdrawals. Inflation is factored, but real-life investor decisions aren’t.
Goals change. Spending may change. A portfolio may fall below the level that triggers social security eligibility. Inflation will change. Human emotion may trigger a panicked decision. A retiree may get bored and take on a part time job. A portfolio may look like a number on a screen, but it’s subject to so many variables that it may as well be a living and breathing entity. Getting the most out of will be an ongoing conversation an investor needs to have with their adviser.
So how much do you need to retire?
It depends.
This article is for informational purposes only and the information contained is of a general nature and may not be relevant to your particular circumstances. The circumstances of each investor are different, and you should seek advice from a professional financial adviser who can consider if particular strategies and products are right for you. In all instances where information is based on historical performance, it is important to understand this is not a reliable indicator of future performance. You should not rely on any material on this website to make investment decisions and should seek professional advice.
Data is sourced from the Australian Prudential Regulation Authority (APRA). The information on this tool is general information only. It should not be taken as constituting professional advice from the Australian Taxation Office (ATO) – or as a substitute for professional advice. The tool does not take into account your financial situation or retirement objectives. The ATO is not liable for any loss caused, from the use of, or reliance on, the information provided directly or indirectly, by use of this website.
Foundation Wealth Planners ABN 84 612 059 622 is an Authorised Representative No. 1242404 and Credit Representative No. 488134 of FYG Planners Pty Ltd, AFSL/ACL No. 224543 ABN 55 094 972 540
Data Source: 80/20: Bloomberg AusBond Bank Bill Index 2.00%, Bloomberg Global Aggregate Bond Index (hedged to AUD) 13.00%, Dimensional Australia Global Core Equity Index (AUD) 16.7500%, Dimensional Australia Global Core Equity Index (hedged to AUD) 16.7500%, Dimensional Emerging Markets Index (AUD) 3.00%, Dimensional Global Real Estate Securities Composite Strategy 7.00%, FTSE World Government Bond Index 1-5 Years (hedged to AUD) 5.00%, Dimensional Australia Core Equity Index 36.500%. 60/40: Bloomberg AusBond Bank Bill Index 2.00%, Bloomberg AusBond Composite 0+ Yr Index 8.00%, Bloomberg Global Aggregate Bond Index (hedged to AUD) 10.0%, Dimensional Australia Global Core Equity Index (AUD) 12.500%, Dimensional Australia Global Core Equity Index (hedged to AUD) 12.500%, Dimensional Global Real Estate Securities Composite Strategy 10.0%, FTSE World Government Bond Index 1-5 Years (hedged to AUD) 20.0%, Dimensional Australia Core Equity Index 25.00%. 40/60: Bloomberg AusBond Bank Bill Index 3.00%, Bloomberg AusBond Composite 0+ Yr Index 17.00%, Bloomberg Global Aggregate Bond Index (hedged to AUD) 10.0%, Dimensional Australia Global Core Equity Index (AUD) 8.500%, Dimensional Australia Global Core Equity Index (hedged to AUD) 8.500%, Dimensional Global Real Estate Securities Composite Strategy 6.00%, FTSE World Government Bond Index 1-5 Years (hedged to AUD) 30.0%, Dimensional Australia Core Equity Index 17.00%. Constructed under AUD. Rebalance: Per 12 Months. Inflation is calculated by Australian Consumer Price Index: Returns are restated after CPI for the quarter is released. Interpolated Quarterly data into Monthly data. Scenarios are calculated by drawing income monthly and drawings are adjusted annually for inflation.