


From pooches to second-hand cars, to homes in regional areas, to ground beef in the supermarket. Everyone has a story about how their money is buying less.
Eight years ago, you could get this good girl delivered to your front for $1300. Today, or more precisely back in January, she went for $7990, and you had to front for delivery. While that’s a jump over 8 years, a good part of it has occurred recently. The pandemic had a spike of people wanting dogs. Breeders can only supply so many dogs, so they had the luxury of pricing according to demand.
Which is essentially Inflation. A supply constraint which leads to a shortage of labour and products, resulting in a higher bid for labour and products and higher prices. The gauge we are given is the Consumer Price Index figure.
There are a lot of theories about what’s included and not included (and why), and not sure if miniature spoodles make up part of Australia’s CPI number, so anecdotes about random observations are interesting, but not that useful. You can only work off the data you’re gifted, no matter how much you dislike it. At the last print in Australia, it was running at 1.1% annually. In the US, where there are bigger concerns, it hit 4.2% in April which led to a small ruckus on world markets in recent weeks.
We know where inflation is, but anyone claiming they know where inflation is going is guessing. There is no shortage of opinions about inflation’s direction.
Macquarie strategist, Viktor Shevets has a theory about why inflation will remain low, at least in the US. In a recent podcast Shevets highlighted 60% of the U.S. private sector economy is intangible assets such as software, patents, brand equity and databases. Previously, tangible assets such as plant equipment and machinery comprised the majority of wealth.
Previously when demand increased in this more tangible based economy, price increases were slow to be addressed, as supply, such as constructing factories and then hiring workers to fill them took time. Software and pharmaceuticals are quicker to respond, meaning demand-based price increase aren’t as common. There’s rarely a supply constraint in software.
Shevets also argues the flexibility of the labour will prevent inflation, with 20 to 25% of people employed in the gig economy. He suggests workers will move quickly to fill sectors requiring increased production and this will keep a lid on wages in contrast to the past.
Noting this, after a spike in 2020, US hourly earnings growth has fallen to the lowest level in years. Back in Australia, wages growth is still nearing 20-year lows. At the same time, we’ve heard plenty of screaming from business and industry groups who have become overly reliant on groups like international students for staffing, and in some instances reliant on paying them under the table at a reduced rate, which contributes to that anaemic wage growth.
With the borders closed we haven’t seen wage inflation show officially, yet the agitating to open the borders or grant special exemptions continues furiously from businesses claiming they can’t find workers. On that front, if there is no spike in wage growth, there may not be a labour shortage, just a shortage of wages.
The pandemic has seen many people hunker down in their own fortress. Spending up big on durable goods around their house as their hair and beards grow, instead of taking holidays, eating out, seeing a show, movie, or getting a haircut. When the demand for durable goods increases sharply, it results in shortages and supply constraints that drive up prices. This set of circumstances seems unlikely to last. Eventually people will be vaccinated, and their spending will transition from durables to services.
The big question. If inflation does come raging back, how does that affect your portfolio?
The last big occurrence of inflation was back in the 1970’s and 80’s. Anyone around then would remember double digit spikes. The prospect of double-digit inflation seems outlandish given where we currently are, but it’s still useful to get an understanding of how assets have performed. The longest data available across various asset classes is in the US. We’ll only focus on the 70’s because that’s when inflation broke out, while in the 80’s you might say it was an embedded part of life.
Here’s how the 70’s looked:
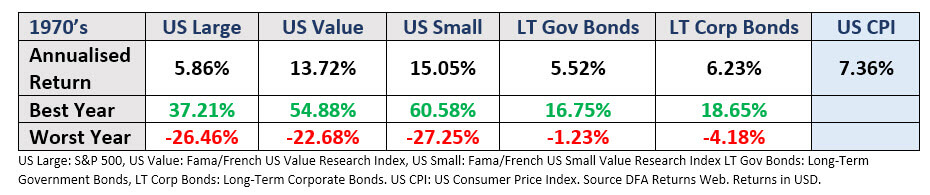
For stocks it was a volatile decade, note the best and worst years. On average across the three stock categories noted, the 1970’s were more volatile than either the 1960’s or 1980’s and stocks were brutalised across 1973/74 when inflation really broke out. Like always an investor had to hold on because it was followed by a massive rally, particularly in small and value stocks.
Inflation will prove frustrating when holding longer dated bonds. In 1974 and 1979 when inflation hit double digits, long term corporate bonds were negative and long-term government bonds were also negative in 1979. Both lagged the CPI figure as a measure of inflation. Stocks, as viewed by the major indexes such as the S&P 500 did terribly. 5.86% looks ok, but then add in inflation at 7.36% and you’ve gone backwards.
This is why you will often hear screaming about gold, hard assets and commodities as the thing to hold if inflation takes off. The comparison will be made with an index such as the S&P 500 and how poorly it performed during the 1970’s. If you want to add a little nuance into the discussion, take a look at US Small and US Value stocks, both kept an investor well ahead of inflation over the decade.
Inflation won’t be pretty, but is it coming? We don’t know. Our only conclusion to draw from this is the same as always. Remain diversified and have a portfolio tilt towards value and small to capture those factors when they emerge. They may play a part in ensuring your portfolio isn’t left behind. Otherwise, you could always breed miniature spoodles.