


Seven News recently featured a story on rocker Jimmy Barnes. Jimmy was selling up his family home in Sydney to move to his new base in the Southern Highlands of NSW. What was the price to take over the working-class man’s converted Botany warehouse? Jimmy was hoping to get $4 million, after paying $1.61 million 17 years ago and spending another $1.6 million on renovations.
The Seven reporter described it as a “clever investment”.
If Jimmy and his family hit the $4 million sale mark (being Sydney, they’ll likely blow past it) we still wouldn’t describe it as a “clever investment”. Putting $3.21 million into something and getting $4 million back after 17 years is an annualised return on investment of 1.3%. Less than the cash rate of 3.57% across that same period. It may not have been a financial winner, but it was a home and one where Jimmy likely enjoyed a lot of good times with family and friends. However, it does go to show how some simple maths can elude the average news reporter!
But those were the good old days. No one is going to be outperforming Jimmy’s 1.3% pa return by holding cash for the foreseeable future. Historically, most investors would see achieving a 1.3% pa return on their cash as offensive. Today it’s almost too good to be true. This applies across the whole defensive investment space. Fixed interest returns aren’t worth boasting about either.
Cash and fixed interest are primarily tools. Cash provides certainty of short-term spending while fixed interest also more certainty around spending, but also portfolio stability, diversification, and the ability to rebalance, both after strong rises and falls in shares. As both cash and fixed interest have provided decent returns at varying times, too much expectation has been placed on both to generate livable returns forever.
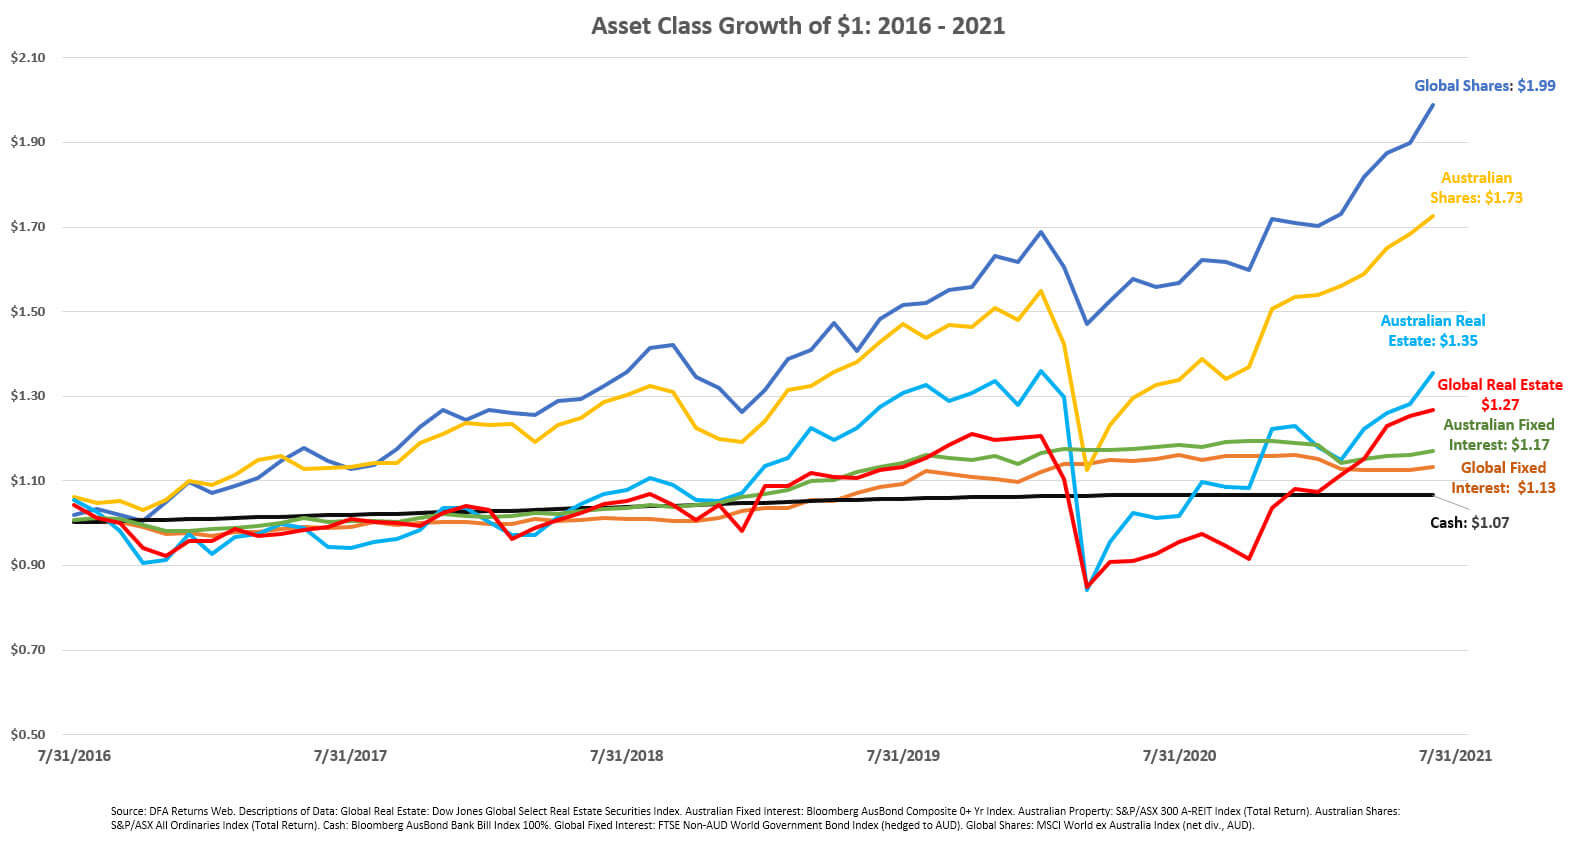
If we look back at the past five years, global and local shares have led the pack by a considerable margin. Global and local listed real estate came through in the middle. Global and local fixed interest tailed, while cash was so flat it almost looks like the Y axis on the above chart! If you invested a dollar in cash back in mid-2016, you’d only have an extra 7 cents to enjoy today.
While the defensive side has struggled, global shares have been historically strong over the past five years, so they also make the other asset classes look exceptionally weak in comparison. Global share returns in the past five years are almost 3.75% above their average annual return since 1980. Australian shares have also been slightly above their average.
The uncomfortable reality is these higher returns have partially filled the void left by fixed interest and cash in some investors’ portfolios. It’s been welcome, but it’s not something that should be expected to continue. The question posed is what should investors do from here?
There are no easy answers, especially if someone is trying to generate retirement income. A time when investors are often encouraged to take less risk. The two options? Draw less/spend less or take more risk. Various scenarios and their outcomes are a good guide to the possibilities when returns and spending are altered.
The following chart shows a $650,000 portfolio with four scenarios: a 5% annual return drawing $50,000, a 5% annual return drawing $45,000, a 2% annual return drawing $50,000 and a 2% annual return drawing $45,000. This is a basic chart and uses consistent annual returns, which won’t be replicated in the real world, but it does offer a guide.
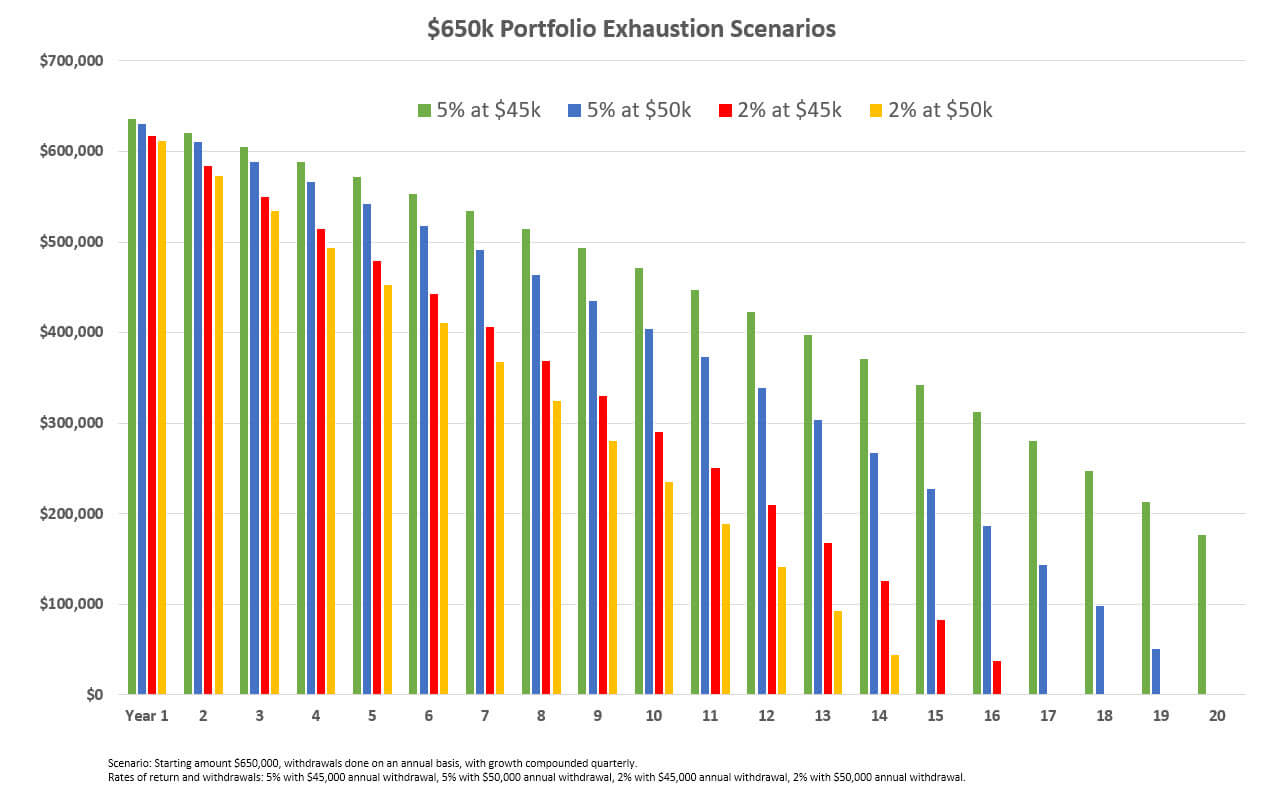
Should you expect 5% or 2%? Nobody knows, but if you’re drawing $50k and only getting 2%, the portfolio is gone in 14 years. Cut your draw by 10% (or $5k) and you can milk it for an extra two years. Get 5% while drawing $50k and it’s 19 years. Get 5% while drawing only $45k, then there’s still $176k left at year 20.
If you’re only getting 2% currently, what does it take to get 5%? More risk, but increasing risk isn’t a guarantee of a higher return. It just means increasing exposure to areas that have historically provided higher returns, such as shares and listed real estate, and it will increase volatility.
If targeting 5% (or higher) is what you want (or need), it doesn’t mean sticking 100% of your portfolio in shares and listed real estate, but it will require an increase in those assets. It’s a conversation to have with a professional because it will require a revaluation of expectations and projections, along with strategies to ensure that investable assets are not left languishing in cash for any longer than need be. The defensive side of the portfolio can still be utilised for the short-term spending, but at this point, cash is dead and holding too much cash will be a significant drag on total returns.
Being fully informed on risk is important when attempting to increase returns. As we’ve said in the past, there will be products happy to talk up their returns while comparing themselves to cash and mentioning guarantees and safety. Inside, these products are accidents waiting to happen, with no historical track record and risks higher than any sharemarket.
Finally, if you’re interested to see how much Jimmy Barnes nets from his home, it’s scheduled for auction on August 28.